Yesterday was Open Data BC’s Open Data Day Hackathon, which was a great chance to learn about civic data sets and spend some hacking on them with data nerds and subject matter experts from the city and province.
One interesting data set is the city’s business license registry, which contains data all the way back to 1997.
Vancouver residents are technically required to hold a business license to pursue almost any sort of non-employment income. That includes renting property.
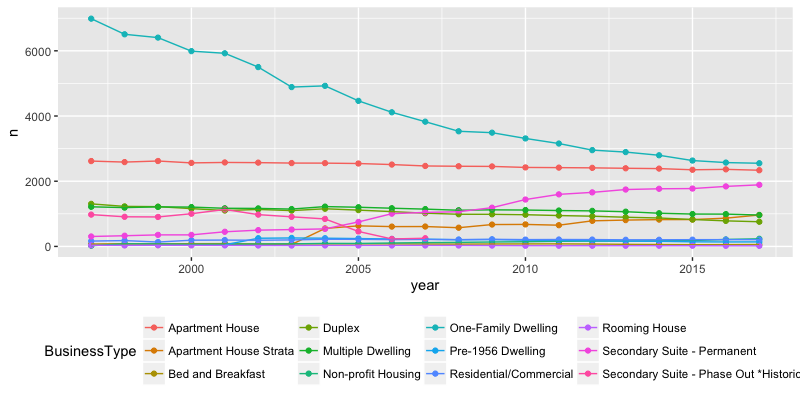
I didn’t quite find a story I wanted to tell with the data, but one surprising trend I noticed was that the number of licenses associated with single-family housing rentals (teal line) has been declining year-over-year.

The trend is repeated in almost every neighborhood except for very built-up neighborhoods with very few single-family structures like the CBD, West End, and Fairview.
Some explanations for this trend could include:
- Poor awareness of the responsibility to hold a permit: the number of licenses issued appears much smaller than the number of housing units, so maybe all we’re measuring is decreasing compliance. (I think this is probably the most likely interpretation.)
- Densification or multiple-unit conversions reducing the number of single-family structures available to rent. I think this is a factor in some neighborhoods, but I wouldn’t expect the effect to be so uniform across the city.
- Increased occupancy of single-family structures by owners, or an increasing number of empty structures, as the expected investment return on the property swamps the expected profit on a rental.
Some more reliable data sets about housing in Vancouver include city building permits, which is only available for CY 2017 forward but promises to be a valuable resource, and CMHC’s information portal, best accessed through Jens von Bergmann’s R package.
Do you have another explanation? What kind of stories would you like to be able to tell about how and where businesses open and close in the city?